post by Torran Semple (2021 cohort)
During summer 2022, I was on placement with my industry partner, Nottingham City Council (NCC). My main responsibility was to draft NCC’s annual Domestic Energy Efficiency Fuel Poverty report, which combines statistics on fuel poverty, energy efficiency, housing quality and energy prices, as well as information about fuel poverty grants (e.g., financial assistance for Nottingham residents). The report was aimed at various groups, including the public, third-sector organisations and local businesses, therefore there was a particular focus on how to effectively communicate information to all audiences. Given the report’s potentially varied readership, I was determined to use data visualisation techniques to communicate information in a way that was attractive to any reader. Rather strikingly, none of the council’s previous fuel poverty reports included any graphics and were instead populated with (objectively) cumbersome tables.
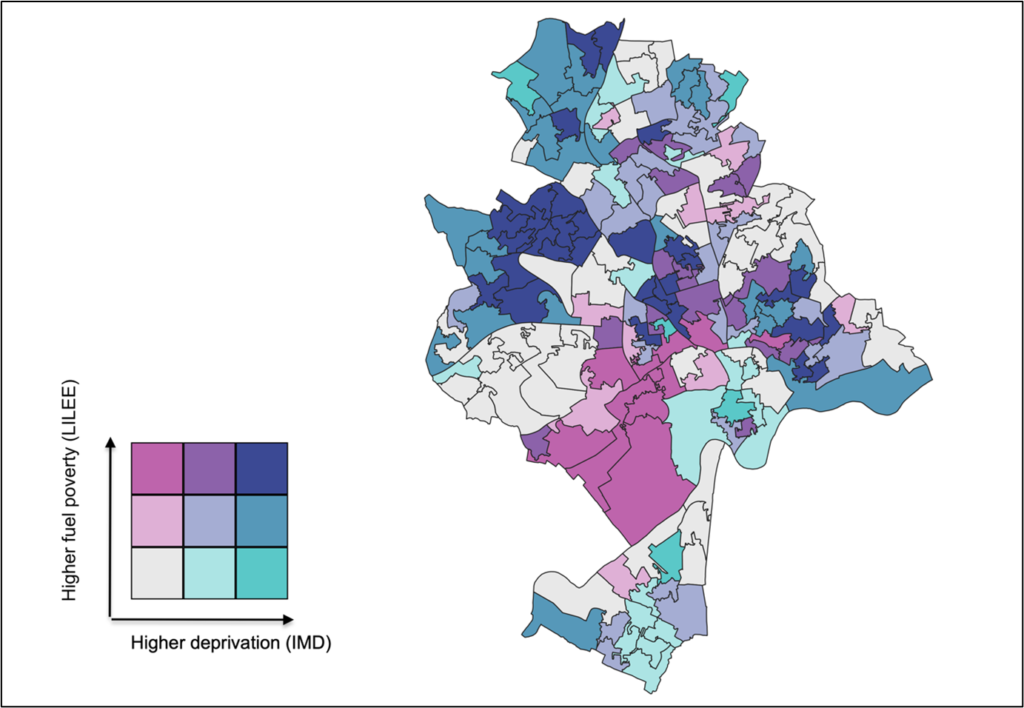
Fuel poverty is caused by a combination of factors, including housing quality and household income. Given that there is a geographical aspect to housing and income deprivation, intuitively you would expect the same for fuel poverty trends. Figure 1 shows a bivariate (fuel poverty and index of multiple deprivation) map of Nottingham’s Lower Super Output Areas (LSOAs) that I created to illustrate this point. This graphic is similar in nature to the map I generated for NCC’s fuel poverty report and, pending approval from council staffers, it will also be included in the final release. Nevertheless, this was the perfect excuse to hone my GIS skills – something that had lingered on my to-do list for too long.
Academic and Political Collaboration
Since my undergraduate degree, I have been involved in research projects at the interface of academia and politics. These included analysing public perceptions towards pedestrianisation in Edinburgh city centre and exploring mobility patterns during the COVID-19 pandemic in Scotland. In both projects, Edinburgh City Council and Transport Scotland engaged with our research and in the case of the latter provided invaluable data to aid our analysis. Given the vast reach of governmental bodies, the data that can be captured are inevitably more extensive and representative than what would be achievable otherwise. The same applies to my current working relationship with NCC, and the summer placement provided an opportunity to become familiar with the council’s approach to collecting, storing and sharing data. I did, however, begin to realise that some data are so closely guarded, such as household income and employment data, that some aspects of my research questions would need to be tweaked accordingly.
Although my experience working with NCC was overwhelmingly positive, some differences in working style became apparent. For example, one of my research questions explores issues with the current Low-Income Low Energy Efficiency (LILEE) fuel poverty metric. The metric is controversial as it focuses on household efficiency, rather than the ability of occupants to afford energy, and omits ~40% of homes in Nottingham on the basis that they are too efficient (EPC ratings A–C). From a statistical perspective, this is an obvious oversight and is something that should be discussed and corrected where possible. However, the dominant opinion at NCC seemed to be that this issue was best left untouched, as fuel poverty metrics are imposed at a national level. Eventually, we were able to compromise, and I was permitted to add a short discussion to the report regarding the potential for the current metric to underestimate fuel poverty.
I may be wrong, but I suspect that one unresolvable difference between academic and governmental work is that the latter is subject to a greater level of public and media scrutiny. This likely perpetuates the need for councillors or any other elected officials to present things in a positive light and improve their chances of re-election. As a result, a metric that undeniably underestimates poverty may not be politically disadvantageous, whereas, from an academic perspective, this simply looks like inaccuracy. I still consider this to have been a very valuable experience for myself, as I became more acutely aware of the differences in priorities in an academic and political context.
Final Thoughts
In summary, my placement with NCC provided some excellent opportunities to network and become familiar with local policymaking processes, two experiences that will undoubtedly aid my PhD research. Perhaps most saliently, I now feel more comfortable working in the space that bridges academia and politics, which is of course key to ensuring that my research has real-world impact. I think that I was able to bring a fresh perspective to NCC and generally my ideas were well-received by colleagues. I was particularly pleased that I was entrusted to write the first draft of the fuel poverty report and that some of my ideas, such as including visualisations as communication tools, were adopted and will hopefully continue to be used in the future.