Small visit to Big Dat – winter school conference in Ancona

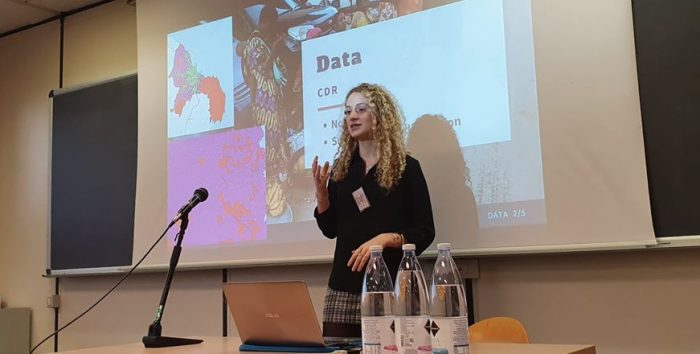
Post by Vanja Ljevar (2017 Cohort) reflecting on her experience at BigDat2020

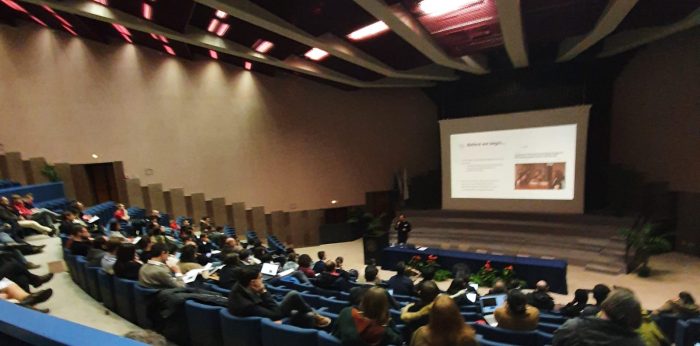
Big Dat was an international data science winter school that gathered many influential data scientists (currently working in industry), but also a vast number of postgraduate students, lecturers and other data science enthusiasts. This winter school was organised by Politecnico Italia, in Ancona, and lasted for 5 days, during which there were interactive workshops and talks given by international speakers. The concept was: we had an option to chose which morning lectures we were interested in attending; the morning lectures were concluded by a lunch where we had a chance to socialise with other equally minded data scientists. In the evenings we had arranged meetings with other participants for socializing, dining (and even dancing!).

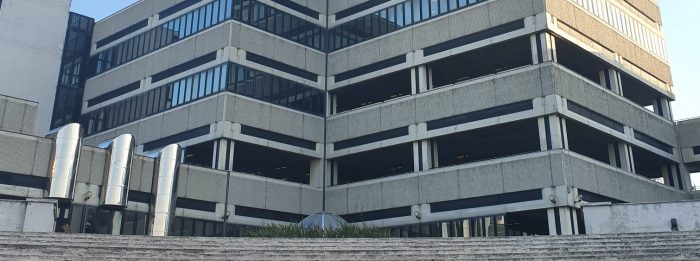
One of the benefits of participating in this winter school was exploring Ancona during our free time. Being a very atypical Italian city, it is a well-kept secret, away from other touristy-crowded Italian attractions. However, this city of barely 100.000 people has a very rich history, maintained through old churches, small Venice-like streets (but no channels) and markets.
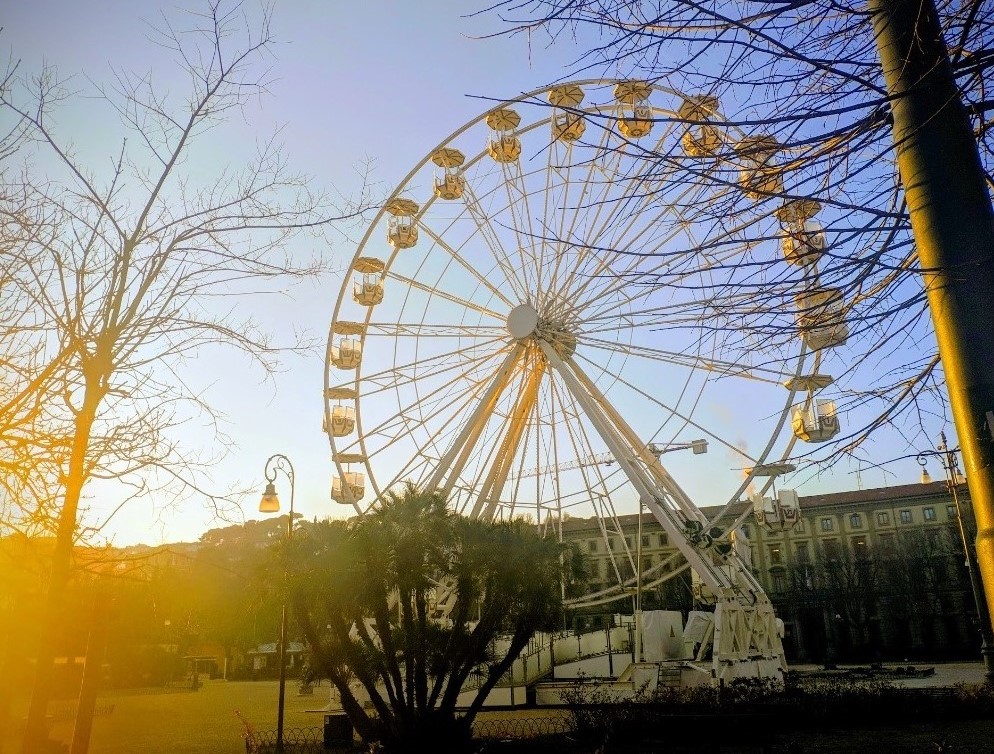
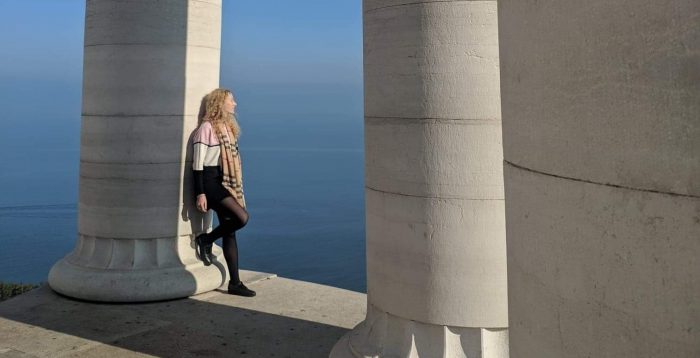
Our hotel was located next to a breath-taking monument – Il Passetto. This is an example of fascist architecture, commemorating the second world-war victims.

Apart from Ancona’s beautiful sights, some of the most relevant highlights of this winter school proved to be interesting ideas and concepts that can inspire data scientists to produce more effective, more creative and more ground breaking work. Bellow are only some of the examples.

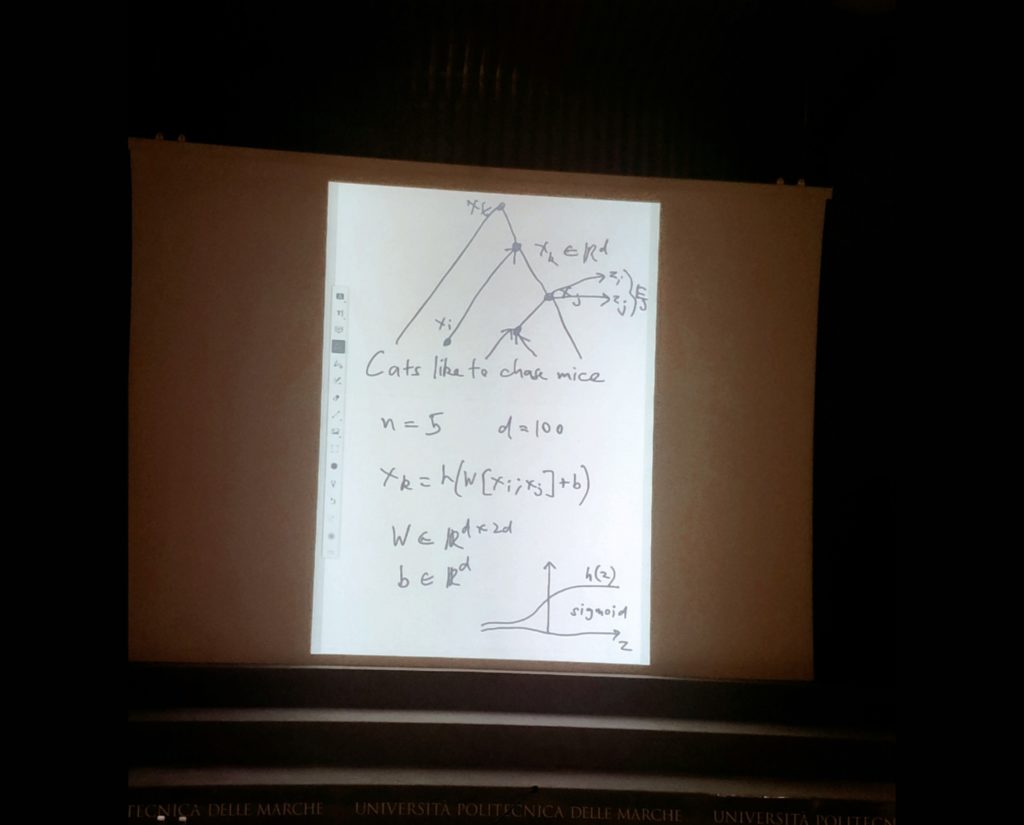
The power of handwriting

Dr Charles Elkan, from the University in Califonia gave an incredible introductory lecture on deep learning. This lecture was focused on maths behind the concept and shed a new light on backpropagation, name entity recognition and co-reference resolution. However, the highlight of the presentation was the use of PowerPoint slides, in a way I have never seen before. Instead of creating a standard set of slides, Dr Elkan put on a screen his hand-written pages. After going though several (already) written slides, he wrote mathematical formulas in real time and we could see them on the screen. This provided the sense of a more personal, even face-to-face teaching environment, which we used to have with teachers in primary schools. This meant that we could all approach this largely popular, but also inaccessible (and may I add scary) field – from scratch (literally!) and with a more comforting and nurturing approach.

Occan’s razor

Another amazing set of lectures was given on the topic of Process Mining. Process Mining was more business – focused lecture about the family of techniques that support the analysis of business processes based on event logs. Presented as a highly relevant field of research, process mining was introduced though its four main characteristics: generalisation, precision, fitness and simplicity. The explanation about why simplicity is extremely important for process mining, the speaker mentioned the Occan’s razor – the problem-solving principle that states: when presented with competing hypothesis that make the same prediction, one should select the solution with fewer assumptions. The reason why Occan’s razor theory is particularly interesting is because it reflects the fact that this winter school was not only focused on delivering new knowledge about the latest progress in the filed, it also enabled us to share underlying theories and ideas that any data scientist and developer should have in mind during research. To further illustrate similar concept explained in the light of process mining, there was also a mention of the ‘conformance checking’. This is another concept that saves us from the bias of ‘unfairness’. To illustrate, if we ask who is the doctor who killed the most patients, it is highly likely to be the most experienced one (simply because they had seen the most patients!). Process mining takes into account such biases, which makes it fair and efficient.

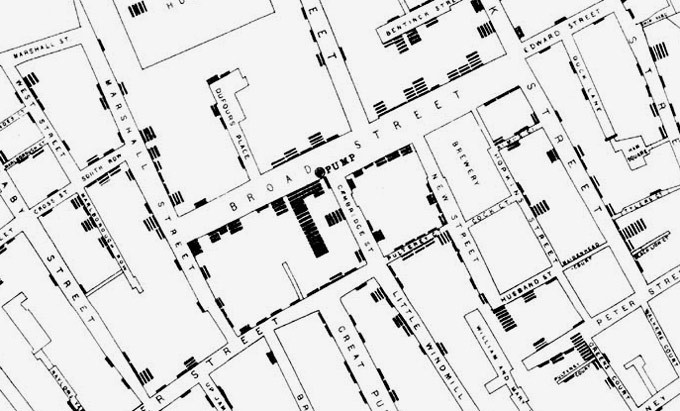
How to produce nice graphs Be a detective

We walked into this lecture knowing one power of data visualisation: to communicate results in a more engaging and interesting way. Everyone likes nice graphs and we are always in search of new and more powerful softwares that will enable us to create them. However, this lecture was not about pretty graphs, it was about the true power of data visualisation – story telling and detective work. We learned presenting data visually is relevant not only because sometimes there are statistics that are the same, but their underlying data is different. Data visualisation is also a sort of detective work, aimed at creating work that presents several parts combined to respond to questions such are: who, when, what, where. The ultimate goal is finding a response to questions like why and how. To illustrate, the presenter gave us a story about John Snow and 1800’s London during the outbreak of cholera. Even though doctors and scientists believed it was the bad air that was responsible for cholera, John Snow decided to visually present the map of cholera cases in Soho, in 1813. Based on this visual representation of cases, John Snow was able to respond to a very important question – what do all these cases have in common? It turned out that all these patients retrieved water from the local street pump. After removing the pump’s handle John Snow effectively stopped the outbreak and unknowingly unlocked the power of data visualisation that today exists at every data scientists reach.

Summary

Overall, BigDat 2020 was addressed to students, researchers and practitioners who want to keep themselves updated about recent developments and future trends. It was a memorable research training event, with a global scope, aiming at investigating advances in the critical and fast developing area of big data, but also society itself. This was of particular relevance to my PhD as I got a chance to learn more about Natural Language processing, Deep Learning and speak to the leading experts from the field.  In fact, interaction was the main component of the event, reminding us all that we are always in a continuous pursue of knowledge, regardless of whether we are industry practitioners, renowned academics, industry pioneers or merely a 3rd year CDT students.

5 out of 5 stars!

Returning from BigDat2020

post by Maddy Ellis (2016 cohort)
reflecting on her experience at BigDat2020

BigDat 2020

6th International Winter School on BigDat
Department of Information Engineering
Marche Polytechnic University 
Ancona, Italy – January 13-17, 2020

Big Data in a growing field with ties into a number of academic tracks. The variety of sources, applications of Big Data create a large spectrum of challenges and advances which have potential for huge impact on scientific discoveries in business models, society, medicine and numerous other fields. BigDat2020 brought together researchers, academics and industry pioneers to facilitate learning, collaborations and idea sharing. 

During the winter school seminars and lectures were put on in a number of areas such as, major challenges of analytics, infrastructure, management, search and mining, security, privacy and applications. Alongside these courses from a number of inspiring speakers, the event also hosted daily lunches and breaks which motivated active and promising interactions from research students. Below are some reflections of my experience at BigDat2020. 

18th Century Insights into
21st Century Problems


During the winter school Rory Smith (Monash University) ran a series of lectures on ‘Learning from Data, the Bayesian Way’. The goal of these lectures was to take a Bayesian look at statistically optimal ways to detect and extract information in noisy data. This lecture series addressed a range of Bayesian related topics from inference and parameter estimation to sampling methods and hierarchical inference. Coming from a pure mathematics degree these lectures appealed to me the moment I saw them in the schedule. An early slide in the course read “18th Century Insights into 21st Century Problems”. This really resonated with me. My PhD is an interesting hybrid between the application of mathematics into modern issues such as poverty and development. Often in my literature review I have come across papers from over 100 years ago and yet the mathematics not only still hold but is fundamentally routed and often unchanged in work done today. There is something beautiful about this. It’s like visiting an old cathedral and admiring the strength of large pillars which have stayed standing through years of weathering and generations of visitors. 

Bayesian methodology is a statistical tool introduced by Rev.Thomas Bayes in the 18th century, yet it is vital in providing solutions to a variety of statistical issues and problems presented by researchers today. It’s incredible! Bayes approach can be used to compliment a range of statistical methods and I would recommend researchers from any field look into learning some basic Bayesian statistics to see where they could be used in their work.

Accessibility


Another thing which stood out to me at this event was accessibility. Big data is such a broad topic and is applied in so many fields now that scoping an event tailored to all these fields is inevitably difficult. People attending this conference ranged from pure data scientists and statisticians with intricate knowledge of a range of big data areas, to people from humanity schools looking to learn what big data is to apply it to their work. Knowing this I was pleased to see that the schedule of the events include a vast range of understanding requirements for different talks. Everyone was able to pick talks which suited their needs. Many of the talks though-out the week were however given as a follow on to previous talks in the week on the same topic. The meant that there were some big leaps within and in between talks. You could sit in an hour long talk and spend the first 20 mins feeling like you were not learning anything, then be totally lost by the last 20 mins. I think this is an inevitable part of interdisciplinary work, there will be moments when you feel things are too basic and moments of overwhelming confusion. This can really feed into impostor syndrome. What I did like about this event is that there were ample resources online provided after each talk which pointed people in the right direction both for learning the basics and extending topics to more complex levels. PhD can be very isolated, you work on a tiny specific area of what you do, and often you are the only one doing it. Sometimes you might read a paper or article which leaves you totally baffled and not even knowing where to look up the information you would need to understand what the paper was talking about. Events like this help to combat these issues of accessibility and impostor syndrome – they unite people and present an opportunity for experiences to be shared and questions to be asked.

My presentation


During Big Dat I presented a summary of my recent work. One thing I talked about during my presentation was data cleaning. After this presentation someone approached me and explained that they had experienced similar ‘messy data’ issues in a completely different dataset and field of study. This sparked a really interesting conversation about the challenges we have both faced and led to us both going away with various notes on our phone of ‘Things to look into’. Without the opportunity to present this conversation would never have happened. If I could speak to my younger self of future researchers starting on the PhD journey I would encourage them to take every possible opportunity to present their work. Not only will the practice build their confidence presenting and spark useful feedback and discussions but they will also get to know their work better and be pushed to clarify aspects of work.

It’s a boy thing…


Another reflect I had of this week is an ongoing reflection throughout my educational experience. I did my undergraduate degree in mathematics. Many of my lectures, seminars and tutorials showed disproportionally many boys compared to girls. This was also reflected in the teaching staff on the course. At the time I remember questioning it and thinking why is it like this? At what age does this separation start? Who’s responsibility is it to engage young women in the field? Sitting in my first talk at Big Data I was brought right back to all those questions. I picked the more technical of the two morning sessions and in a room of nearly 100 people I could only spot about 5-6 girls. Although not as extreme, the rest of the event also had notably more boys in attendance than girls. The gender gap in the professional world is closing, albeit slowly. However the data science and more broadly tech industry are still lagging behind despite being considered a modern field of work. Problem in the work force such as pay gaps, marginalisation and discrimination are not born in the work place, they grow throughout our education. I am lucky enough to be a part of a number of different projects involving young people. After coming back from this event I am inspired to talk to these children (both boys and girls) about the wonderful world and opportunities in STEM. 

There are big questions around this. What causes these problems? And more importantly, what can people along the education path, and working in the data science industry do to solve it and be more inclusive. It could take a lifetime to answer these questions, but I want to take these thoughts with me in my career. Whatever I end up doing I want to use my research (PhD and beyond) to show young people just one of the many incredible uses of STEM knowledge.

Gratitude


This is the final year of my PhD… the famously dreaded write up year. I am certain there will be points when I wonder “Why did I do this?” “Can I do this?” “Will it all be okay?” I know I will get wrapped up in various bubbles of stress and panic. 

Fact…. It’s gonna be tough! 

That being said, I am currently writing about the reflection of an academic event I attended in Italy. An event where I learnt all sorts of things about statistics, data visualisations and problems of privacy in big data among other things. An event which led me to meet all sorts of fascinating people at various points in their career researching a range of things from road safety to spread of disease. An event which allowed me to see Ancona, a city founded by Greek settlers and today one of the main ports on the Adriatic Sea with a colleague and close friend. An event where I had the opportunity to present my work and get feedback from knowledgeable experts allowing me to improve my work. How wonderful right?! 

This is just one of the many things which had happened to me because I became a PhD candidate. My approach to getting through this year is to pop my stressful bubbles with gratitude. Before writing this Big Data reflection I wrote a list of things which I am grateful for through my PhD. Random items from this list are now scheduled to pop up at various points from now until my completion date, giving me some much needed perspective. No matter how stressful I find this year, it’s a privileged stress to have and I intend to appreciate as much of it as possible. Here are just a few examples of things I am grateful for. 

Coding – Early on in my PhD my supervisor encouraged me to take the time to make friends with Python. I couldn’t have even considered the opportunities and doors this skill will open before I started. 

Mathematics for Development Bridge – However nerdy and cheesy its sounds I love maths and I love helping people. This PhD has shown me that there is a place for both. I can be a part of work with real impact without giving up my love of mathematics.

People – Where to start with this one? The range of wonderful people I have met through this PhD is incredible! I’ve met inspiring people who are doing incredible work, like-minded people, people from totally different lives and fields to me and, people who have become lifelong friends.

These are just three of a long list, but there is so much more; seeing the world, personal growth and awareness among other things. For any fellow PhD students in their final year… we got this! 

Key Take Aways


Maths is timeless and beautiful! (And have a look at Bayesian Statistics) 

Scoping large interdisciplinary events is hard, but worth it! 

There is more to be done in terms of gender equality, and I want to prioritise this in my own career. I wanted to do this PhD – and my gosh am I grateful for the opportunities it has given me! 

 -originally posted on Maddy’s website