Post by Vanja Ljevar (2017 Cohort) reflecting on her experience at BigDat2020
Big Dat was an international data science winter school that gathered many influential data scientists (currently working in industry), but also a vast number of postgraduate students, lecturers and other data science enthusiasts. This winter school was organised by Politecnico Italia, in Ancona, and lasted for 5 days, during which there were interactive workshops and talks given by international speakers. The concept was: we had an option to chose which morning lectures we were interested in attending; the morning lectures were concluded by a lunch where we had a chance to socialise with other equally minded data scientists. In the evenings we had arranged meetings with other participants for socializing, dining (and even dancing!).
One of the benefits of participating in this winter school was exploring Ancona during our free time. Being a very atypical Italian city, it is a well-kept secret, away from other touristy-crowded Italian attractions. However, this city of barely 100.000 people has a very rich history, maintained through old churches, small Venice-like streets (but no channels) and markets.

City Centre of Ancona
Our hotel was located next to a breath-taking monument – Il Passetto. This is an example of fascist architecture, commemorating the second world-war victims.

Apart from Ancona’s beautiful sights, some of the most relevant highlights of this winter school proved to be interesting ideas and concepts that can inspire data scientists to produce more effective, more creative and more ground breaking work. Bellow are only some of the examples.
The power of handwriting
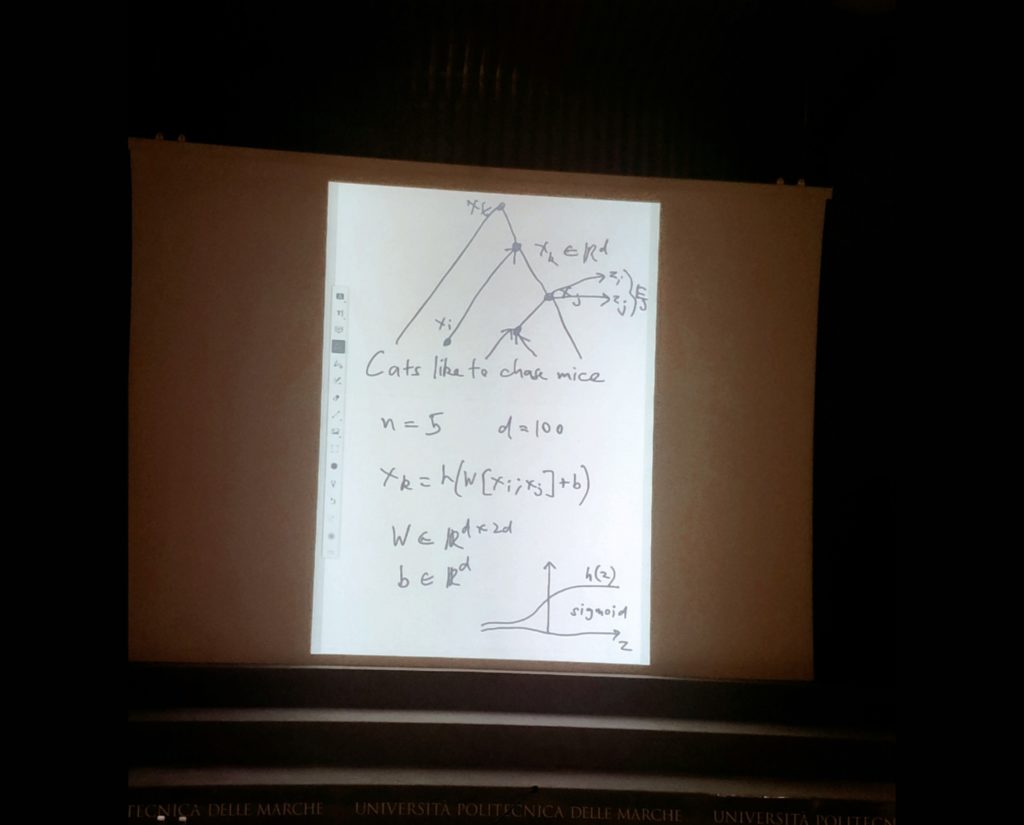
Dr Charles Elkan, from the University in Califonia gave an incredible introductory lecture on deep learning. This lecture was focused on maths behind the concept and shed a new light on backpropagation, name entity recognition and co-reference resolution. However, the highlight of the presentation was the use of PowerPoint slides, in a way I have never seen before. Instead of creating a standard set of slides, Dr Elkan put on a screen his hand-written pages. After going though several (already) written slides, he wrote mathematical formulas in real time and we could see them on the screen. This provided the sense of a more personal, even face-to-face teaching environment, which we used to have with teachers in primary schools. This meant that we could all approach this largely popular, but also inaccessible (and may I add scary) field – from scratch (literally!) and with a more comforting and nurturing approach.

Occan’s razor
Another amazing set of lectures was given on the topic of Process Mining. Process Mining was more business – focused lecture about the family of techniques that support the analysis of business processes based on event logs. Presented as a highly relevant field of research, process mining was introduced though its four main characteristics: generalisation, precision, fitness and simplicity. The explanation about why simplicity is extremely important for process mining, the speaker mentioned the Occan’s razor – the problem-solving principle that states: when presented with competing hypothesis that make the same prediction, one should select the solution with fewer assumptions. The reason why Occan’s razor theory is particularly interesting is because it reflects the fact that this winter school was not only focused on delivering new knowledge about the latest progress in the filed, it also enabled us to share underlying theories and ideas that any data scientist and developer should have in mind during research. To further illustrate similar concept explained in the light of process mining, there was also a mention of the ‘conformance checking’. This is another concept that saves us from the bias of ‘unfairness’. To illustrate, if we ask who is the doctor who killed the most patients, it is highly likely to be the most experienced one (simply because they had seen the most patients!). Process mining takes into account such biases, which makes it fair and efficient.
How to produce nice graphs Be a detective
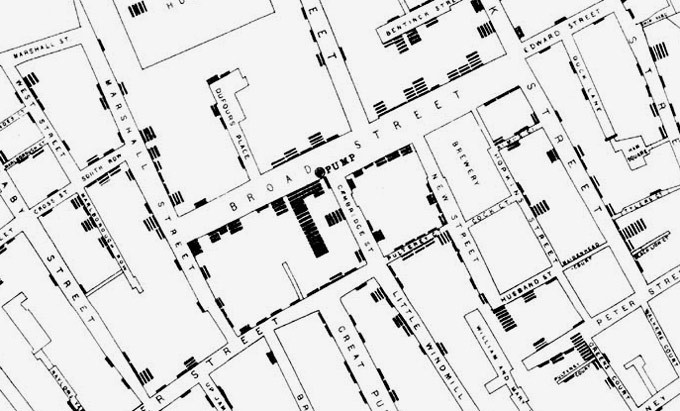
We walked into this lecture knowing one power of data visualisation: to communicate results in a more engaging and interesting way. Everyone likes nice graphs and we are always in search of new and more powerful softwares that will enable us to create them. However, this lecture was not about pretty graphs, it was about the true power of data visualisation – story telling and detective work. We learned presenting data visually is relevant not only because sometimes there are statistics that are the same, but their underlying data is different. Data visualisation is also a sort of detective work, aimed at creating work that presents several parts combined to respond to questions such are: who, when, what, where. The ultimate goal is finding a response to questions like why and how. To illustrate, the presenter gave us a story about John Snow and 1800’s London during the outbreak of cholera. Even though doctors and scientists believed it was the bad air that was responsible for cholera, John Snow decided to visually present the map of cholera cases in Soho, in 1813. Based on this visual representation of cases, John Snow was able to respond to a very important question – what do all these cases have in common? It turned out that all these patients retrieved water from the local street pump. After removing the pump’s handle John Snow effectively stopped the outbreak and unknowingly unlocked the power of data visualisation that today exists at every data scientists reach.

Summary
Overall, BigDat 2020 was addressed to students, researchers and practitioners who want to keep themselves updated about recent developments and future trends. It was a memorable research training event, with a global scope, aiming at investigating advances in the critical and fast developing area of big data, but also society itself. This was of particular relevance to my PhD as I got a chance to learn more about Natural Language processing, Deep Learning and speak to the leading experts from the field. In fact, interaction was the main component of the event, reminding us all that we are always in a continuous pursue of knowledge, regardless of whether we are industry practitioners, renowned academics, industry pioneers or merely a 3rd year CDT students.
5 out of 5 stars!
